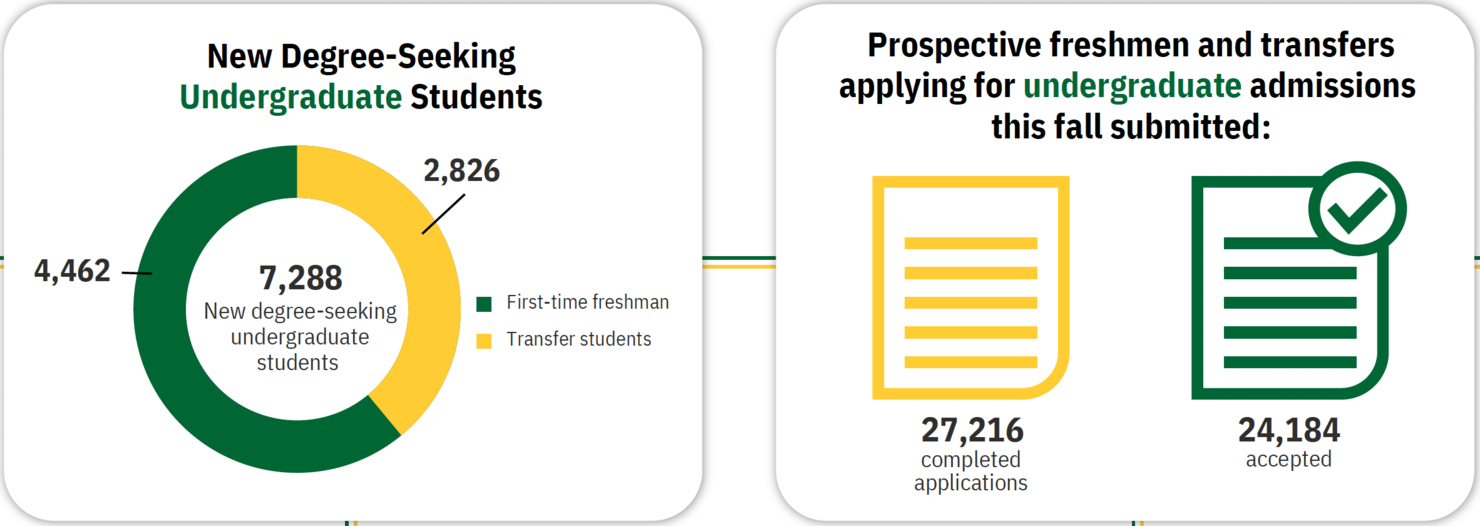
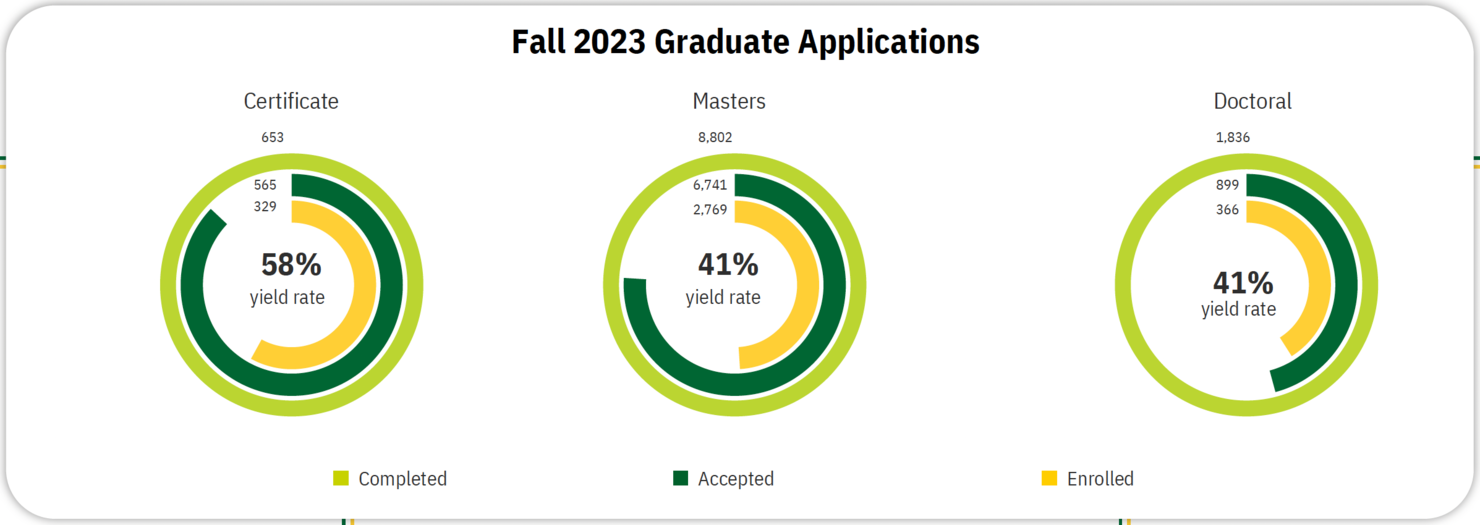
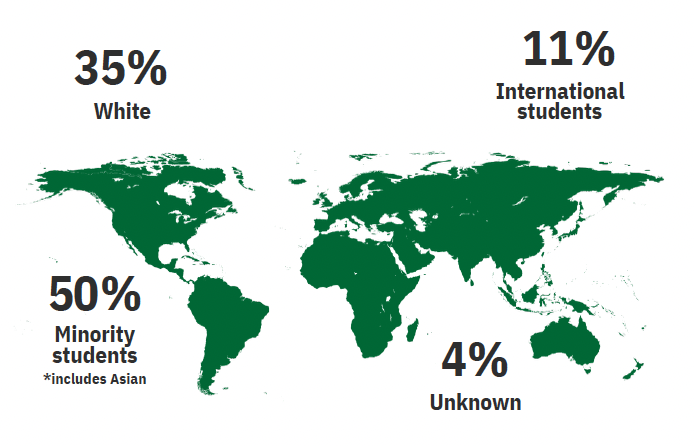
In fall 2023, Mason received 27,216 applications from prospective undergraduate students and accepted 89 percent. Of those accepted, 7,288 new degree-seeking first-time freshmen and transfer students enrolled in courses at Mason. Additionally, Mason received 11,291 graduate applications and 8,205 were accepted. The graduate acceptance rate was 73 percent and the yield rate was 42 percent. Of all enrolled students, 50 percent are minority students with an additional 11 percent being international students.
Undergraduate Admissions

Graduate Admissions

Student Diversity

Methodology Matters
“What is our enrollment?” Seemingly easy and straightforward, this question requires determining the appropriate answer within the context of why the question is asked. In the table below, all the numbers are “right”. But, given the variations of what is or is not included, they don’t “match”. Nor should they. This type of disparity can create confusion. OIEP can assist by providing definitional clarity in getting the answer most appropriate for your question!
|
Fall 2022 Headcount Undergraduate Enrollment |
|
|---|---|
|
U.S. Campuses |
27,014 |
|
All Campuses |
27,572 |
|
Degree Seeking at U.S. Campuses |
26,447 |
|
Following SCHEV Reporting Guidelines |
27,519 |
|
Following IPEDS Reporting Guidelines |
27,014 |
